Wind Data
Why wind direction matters for a search
Wind direction affects how a dog handler plans a K9 search. Knowing which direction the wind is coming from lets the search plan give the dog a chance to pick up scent from a person anywhere in the area, wherever they happen to be.
Karttahimmeli's wind data is based on the ten-minute average from wind observation stations. That data lets you say the air is, on average, genuinely moving in the direction the wind vane shows. Wind speed is also an average: 3 m/s means the scent cone advances 180 metres per minute. The wind can still be gusty and its direction can vary somewhat, but this average direction is really the only thing a search can be planned around. Wind speed also affects the width of the scent cone.
As a rule of thumb, if the two nearest wind stations agree on wind direction and wind speed is at least 2–3 m/s, the wind reading is fairly reliable. It's still worth zooming the map out to check whether all wind vanes within a 100–300 km radius point the same way — if they do, conditions are close to ideal. It's also worth checking the weather forecast.
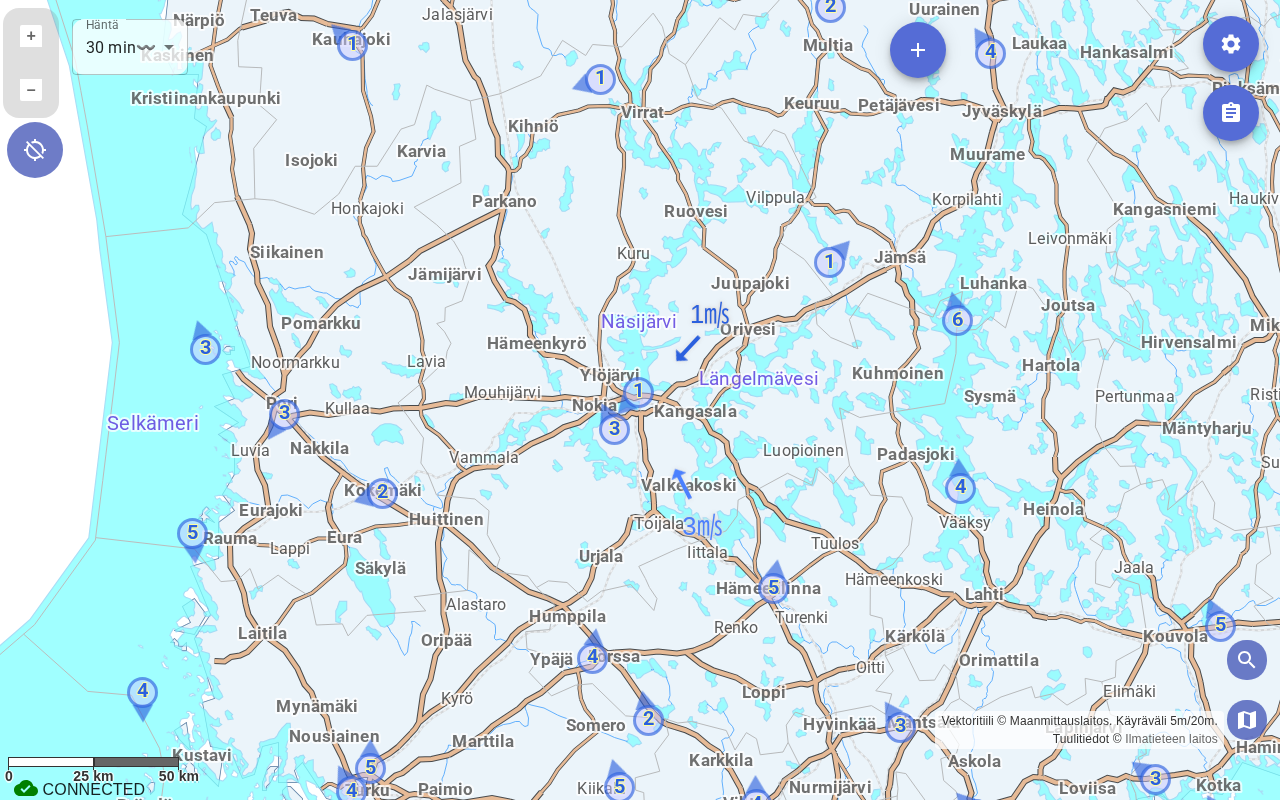
The picture isn't always this good — wind direction based on the observations can be conflicting. Even then it's often possible to establish, for example, that "the wind is at least not coming from the north today", and plan accordingly.
This page describes in detail the data sources behind the wind markers drawn on the map, and how a marker's appearance shows the reliability and freshness of its reading. Wind markers are toggled on/off with the Wind Vanes switch in Settings, see Settings.
Wind data source
The wind data source depends on the current map location:
- Finland – Finnish Meteorological Institute (FMI) observation stations
- Sweden – Sveriges meteorologiska och hydrologiska institut (SMHI) observation station service, supplemented with airport weather station (METAR) observations
- Norway and Denmark – the Norwegian Meteorological Institute's Nowcast model, supplemented with airport weather station (METAR) observations
- Elsewhere – airport weather station (METAR) observations
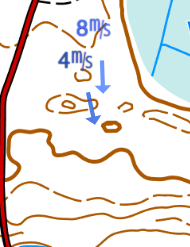
Two wind arrows point toward the centre of the map. They represent data from the two nearest wind stations: the nearest station's direction and speed are shown in a slightly darker colour and closer to the centre point.
Observed vs. modelled data
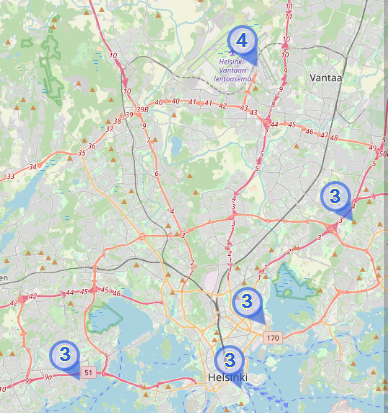
The ring around a wind marker shows whether the reading comes from a real weather station or is modelled:
- Solid ring – a real observation from a weather station (e.g. Finnish, Swedish, or airport stations)
- Dashed ring – modelled data (e.g. the Norwegian Nowcast service)
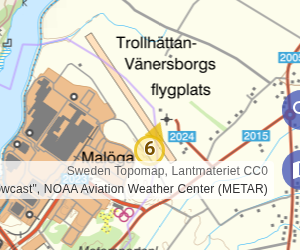
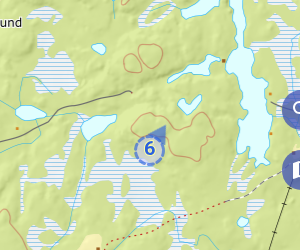
Data freshness
The colour of a wind marker shows how fresh the reading is:
- Blue – the reading is less than 30 minutes old
- Yellow – the reading is more than 30 minutes old
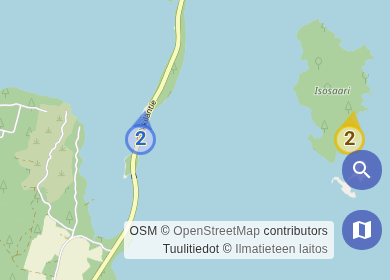
Ten-minute average
Wind speed and direction show the ten-minute average from the observation station in metres per second — not an instantaneous reading.
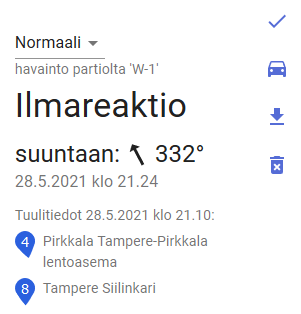
Wind Data in Observation Entries
When an observation entry is made, the current data from the two nearest wind stations to the observation location is automatically saved as part of the observation.